Summary
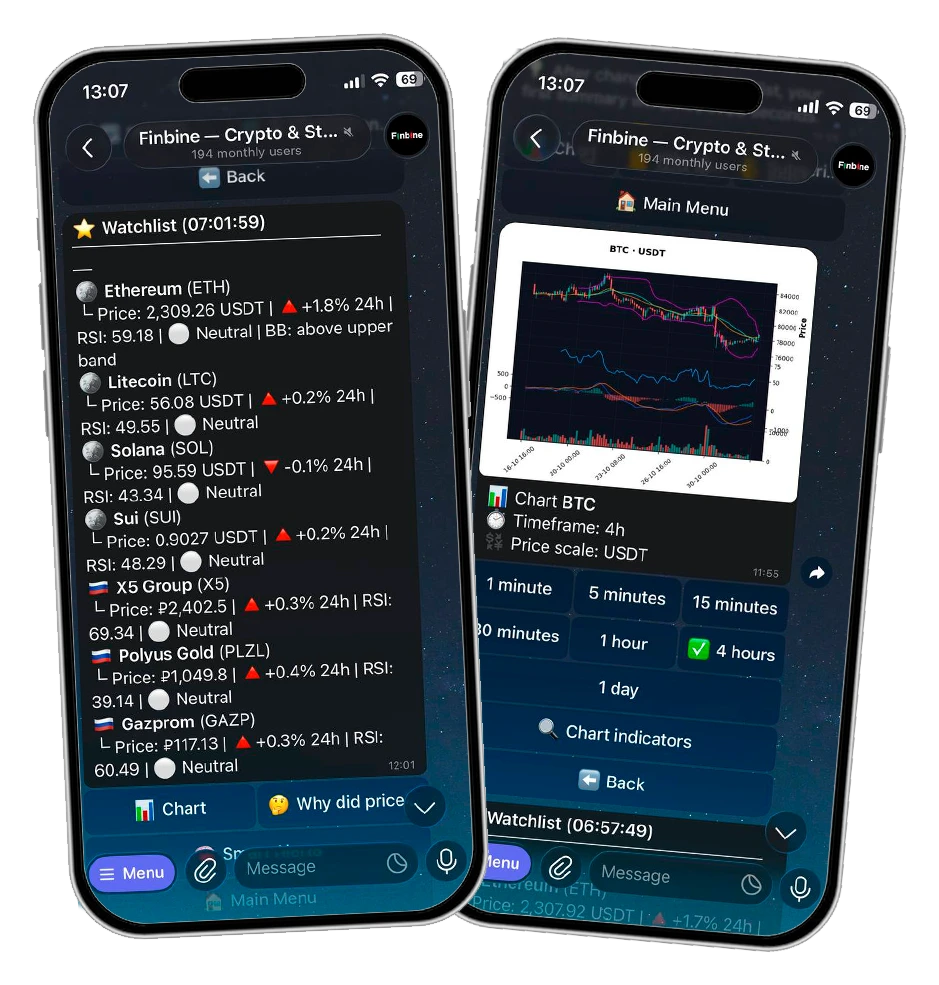
Bitcoin is up 1.1% over 24h to 78,664.07 USDT, testing the upper boundary of its recent 4h range as momentum stays neutral.
Technical picture
Price is now above both the 20-candle SMA at 77,761.38 USDT and the 20-candle EMA at 77,899.2 USDT, indicating mild short-term bullish alignment on the 4h timeframe. The move places Bitcoin directly at the 20-candle high of 78,664.07 USDT, which acts as immediate resistance.
RSI(14) at 51.8 sits in a neutral zone, leaving room for movement in either direction without an overbought or oversold signal. Support is defined by the 20-candle low at 76,942.57 USDT, with the SMA and EMA clustered just above that level as a secondary cushion.
Volume
Latest volume is 1612 units, and no spike above twice the historical average was detected. This means the current push toward resistance has not yet shown a clear expansion in participation. Volume units are unknown, so the reading should be treated as relative rather than absolute.
News context
• Galaxy Calls BTC Bottom After Binance Hack as Pepeto Presale Hits $11.2M — potential relevance: a notable market participant framing the post-hack level as a bottom could influence sentiment, though the presale portion is unrelated.
• Binance resumes bitcoin, ether withdrawals after recovering 95% of $6.3 billion in crypto theft — potential relevance: restoration of withdrawals may reduce near-term fear around exchange solvency and support price stability.
• Bitcoin staking platform suffers $1.5 million exploit — potential relevance: a small-scale exploit with limited direct BTC market impact, but it adds to the broader security narrative.
Interpretation
The alignment of price above both moving averages and the test of the 20-candle high suggests buyers are attempting to convert range resistance into support. The neutral RSI means this push is not yet stretched, but the absence of a volume spike leaves the breakout attempt unconfirmed. News around Binance resuming withdrawals may be contributing to a calmer backdrop, but the price move and headlines coinciding does not prove a causal link.
Short-term outlook
If Bitcoin closes a 4h candle above 78,664.07 USDT with rising volume, that would signal a range breakout and could invite continuation in the following 24–48 hours. Conversely, if price rejects this resistance and falls back below the 77,899.2 USDT EMA, the more likely scenario is a retest of the 76,942.57 USDT support; a close below that level would invalidate the current bullish structure.